Mobile Game Analytics

How to understand what the user’s behavior is inside the game application, what motivates to continue playing and what is an obstacle.
Let’s analyze the behavior of users of the game, as an example, let’s take the public dataset of the game Flood it.
I did not find the game itself on Google Play, available for download, but to understand what kind of application it is, what is the logic and mechanics of the game itself, below I give a link to an application very close to the data from which is in the dataset.

Tables with lots of data and chunks of SQL code are great.
But without correct data visualization, it is difficult to see the whole picture of what is happening, any patterns. What users are doing inside your game.
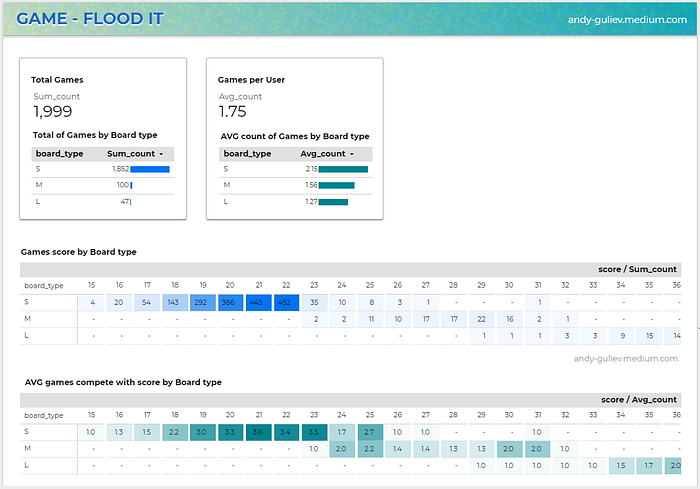
Therefore, let’s start by looking at the Dashboard, with the visualization of user behavior data.

On the dashboard, we can see:
a) how many times users have launched the game in quickplay mode / on what size boards
b) the average number of launches per user, on each type of game board
c) detailed table of how many times in total, how many steps the players were able to pass one or another board, for example: the bulk of the players, 452 times were able to pass the board of size S, in 22 steps. At the same time, there are supermen among the players who were able to complete this board in 15 steps, although there were only 4 such successful quickplay endings.
d) the same detail as in the table above, with a breakdown of the type of board / the number of steps for which it was possible to pass the board — but the indicator here is already different, how many, on average, there were successful passes per unique user level in a certain number of steps.
Judging by the data on the dashboard, we see that the main life in the game is centered around the board of size S, the huge difference in the total number of starts on the board S in comparison with the rest can say one thing, when the size of the board is changed, the game process is significantly complicated, which obviously stops the players … if find a way to soften the transition to the next level — you can increase the user’s lifetime in the game, as a result) success is not far off.
The basis for the dashboard in Google Data Studio is a table obtained as a result of executing SQL code in Bigquery:

The onion structure code for building this table:
-- ( 4 ) START Fourth piece of code
--       summary results for each type of boardSELECT board_type,
       score,
       SUM(Count) AS Sum_count,
       AVG(Count) AS Avg_count
       FROM (-- ( 3 ) START Third piece of code
--       the sum of the results of a unique playerSELECT user_pseudo_id,
       board_type,
       score,
       COUNT(score) AS Count
       FROM(-- ( 2 ) START Second piece of code
--       board type and unique user resultSELECT user_pseudo_id,
       FORMAT_TIME('%T',
       TIME(TIMESTAMP_MICROS(event_timestamp))) AS Event_time,
       event_name,
       MAX ( if ( param.key = "value",
             param.value.int_value, NULL )) AS score,
       MAX ( if ( param.key = "board",
             param.value.string_value, NULL )) AS board_typeFROM (-- ( 1 ) START First piece of code / QuickPlay End EventSELECT event_name,
       event_timestamp,
       user_pseudo_id,
       paramFROM `firebase-public-project.analytics_153293282.events_20181003`,
      UNNEST(event_params) AS param      WHERE event_name = "level_complete_quickplay"
      AND (param.key = "value" OR param.key = "board")-- ( 1 ) END First piece)GROUP BY user_pseudo_id,
         Event_time,
         event_nameORDER BY user_pseudo_id,
         Event_time-- ( 2 ) END Second piece)GROUP BY user_pseudo_id,
         board_type,
         score-- ( 3 ) END Third piece)GROUP BY board_type,
         scoreORDER BY board_type DESC,
         score-- ( 4 ) END Fourth piece
So, let’s take a look at each of the pieces of SQL code step by step.
(1) First piece of code
Will give an answer to the question with what result, namely, in how many steps a unique user was able to pass a board of a certain size, using the example of a player … C4CD and his separate party (lines 1 and 2), we see that he was able to pass a board of size S in 18 steps.
The resulting table is:

(2) Secon piece of code
The second piece of code allows you to group all the games of one player, arrange them by launch time, and most importantly, changes the structure of the table. Now we have the achieved result for each individual game and the type of board placed on one line.
The resulting table is:

(3) Third piece of code
Aggregates the results of a player, how many times and in how many steps he was able to pass a particular board. As an example of a player … C4CD, board S, he walked twice in 18 steps, but in 21 steps he did only 1 time.
The resulting table is:

(4) Fourth piece of code
The final table sums up the results. How many times, with what result (in what number of steps) on each type of board S / M / L was in the sum of the launches of the game, and how many, on average, a unique user achieved what results.
The resulting table is:

